
Gas Prices Down, Power Prices Up: The Misunderstood Hedge
"Does a natural gas producer have a good natural hedge against fluctuating power prices in Alberta?" It would make intuitive sense. But the simple answer is no, most of the time.
[This article is not financial or investment advice, but provided for general information purposes only. All information is subject to change and should not be relied upon for any decision making. See Webpage Terms of Use.]
The Concept
The concept makes sense: Gas dominates the generation mix in Alberta - 26% Cogen, 17% Combined Cycle, 13% Gas-fired Steam, 4% simple cycle (nameplate; see AESO Dashboard for the latest figures). Gas-fired generation sets the pool price most of the time. The marginal cost of gas-fired power is primarily set by the cost of fuel, i.e. the price of NatGas. The hourly pool price should thus be highly correlated with the price of NatGas. And therefore, NatGas producers should have a strong “natural hedge” for their power costs. It’s very logical.
The Reality
Obviously the topic is quite complex, and there has been plenty of debate over whether prices are justified given asset costs, ramping requirements, and so on. For anyone interested in more details, we highly recommend the Market Surveillance Administrator’s excellent quarterly reports. We won’t engage in this discussion here. We just want to know whether based on available data, NatGas prices are a good hedge for power prices. In other words, if producers who are long gas incur higher power costs, is this higher expenditure balanced by higher gas sales revenue? A single graph best answers the question:
To answer the question of whether a producer's long position on natural gas serves as a reliable hedge for their power costs, we will set aside the complex debate around market design and price justification. Our focus is purely on the data: Does a producer's higher expenditure on power, caused by rising prices, get offset by a corresponding increase in their gas sales revenue? Let’s look at two decades of price data:
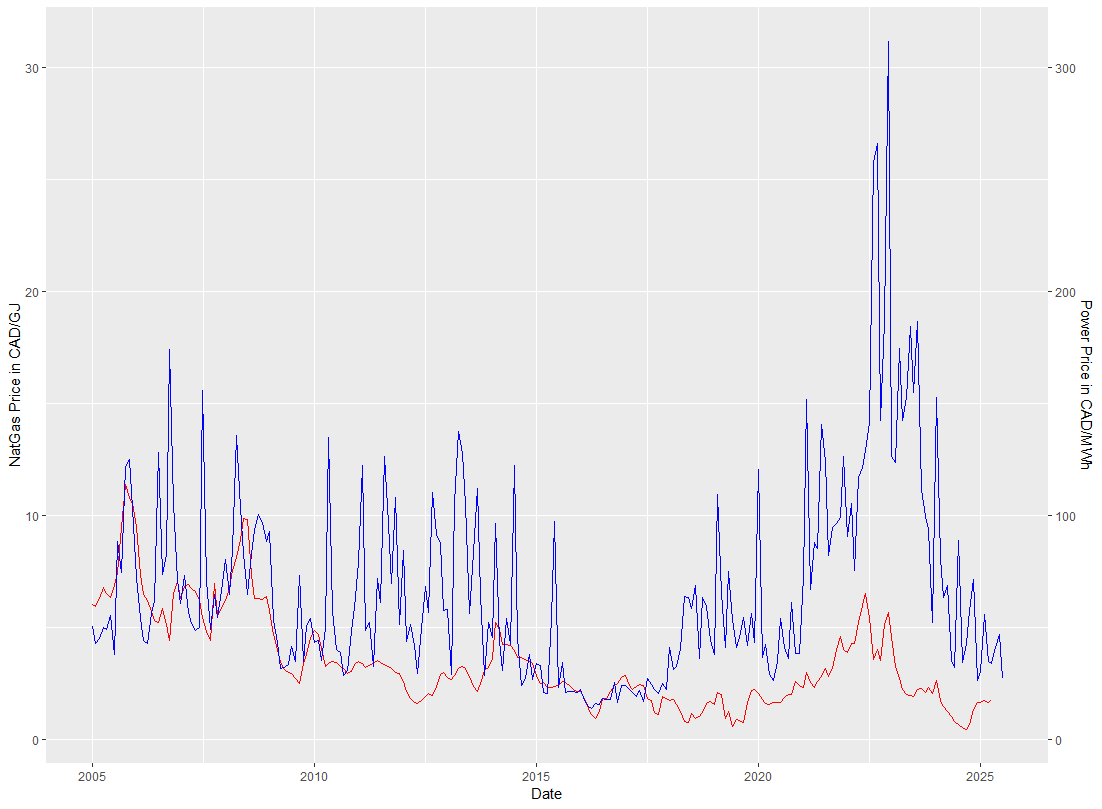
AB Gas vs Power prices, 2005-2025
The red line shows the average monthly AECO gas price in CAD/GJ against the left axis, the blue line the average monthly AESO pool price in CAD/MWh against the right axis. The y-axes are aligned with an implied heat rate of 10 GJ/MWh.
For a good hedge, the red and blue “zig” and “zag” in the same direction and by similar amounts. And sometimes they did so rather well, especially around 2016. But most of the time, especially most recently, they didn’t. Will the recent return to a lower price environment bring back that higher degree of correlation? Good question. Maybe yes, maybe no. Judging from the graph, this could be a risky bet though.
For gas producers with significant power bills, it may be worthwhile exploring alternative cost and risk management options.
We would be happy to help!
Interested in a deeper understanding?

Alberta's Power Market is Changing.
Are You Ready?
The 2026 Market Restructuring is coming. Get ahead of the curve by joining peers from Canada’s leading energy companies for our one-day training course on October 2nd.
Gain the foundational knowledge you need to navigate what's next.
Limited Seats. Register by Sept. 15th for Advance Pricing.